
The monthly PDF is stale the day it lands
Here is the loop most agencies run. You spend half of the first day of the month pulling numbers from five platform dashboards, drop them into a deck, and email it. The client opens it, maybe. Two weeks later they email to ask how the TikTok push is doing, and you pull the numbers again, by hand, to answer one question. The report was a snapshot the moment you built it, and the account kept moving.
The fix is not a better PDF. It is to stop making the client wait for a static document to see their own results. A live reporting dashboard gives the client a view they can open whenever the question occurs to them, and it gives you back the hours you were spending assembling numbers on demand. The monthly report still has a job, but it changes from a data dump to a short, written read on a dashboard the client already trusts.
What a social media reporting dashboard for agency clients actually is
A social media reporting dashboard for agency clients is one screen that pulls a client's performance from every connected platform into a single live view. It shows the metrics that matter to that client, reach, engagement, follower growth, and the results tied to their goal, and it updates as the account moves rather than freezing at the moment you built a slide. The client reads a running picture, not a month-old snapshot.
The difference from a report is access and freshness. A report is a document you produce and send. A dashboard is a place the client goes. One is a push on a schedule, the other is a pull on demand. Run both from the same numbers and they stop competing: the dashboard answers the day-to-day question, and the monthly report adds the context and the story around what the dashboard already shows.
Why scattered platform data kills the dashboard idea
Most agencies would happily give clients a live dashboard. What stops them is the data. A client on Instagram, TikTok, LinkedIn, and a couple of others means four or five separate analytics panels, each with its own login, its own export format, and its own idea of what a view or an impression is. You cannot share a live view of something that only exists as five browser tabs you reopen by hand.
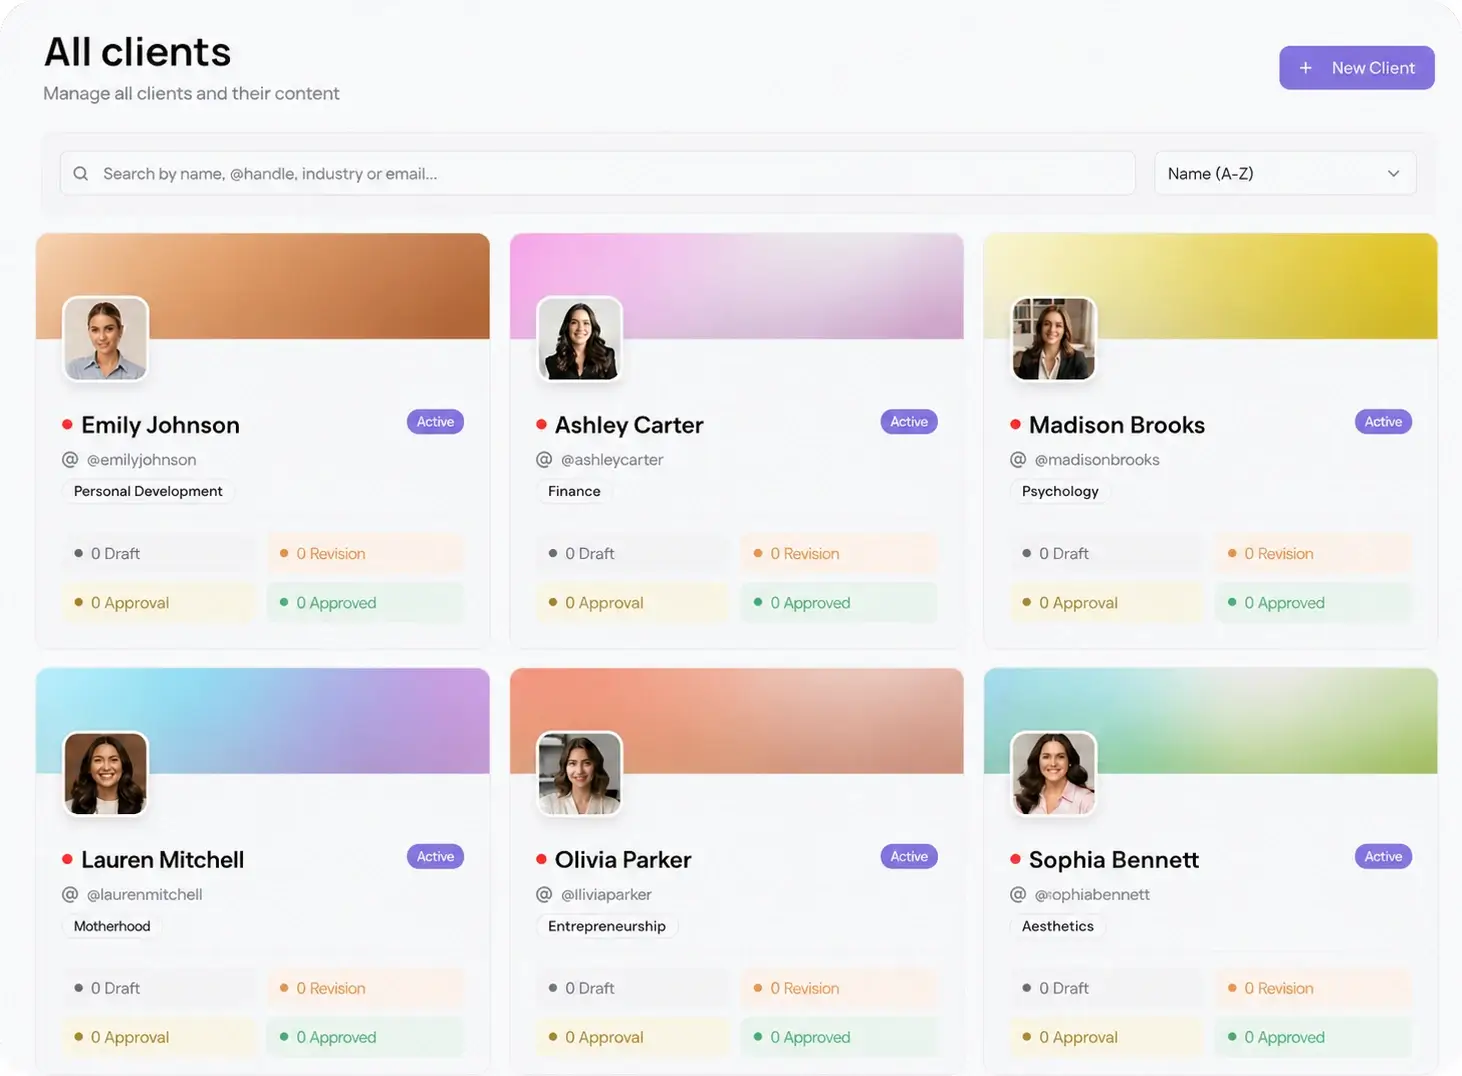
The only way a live dashboard works is to run every client account in one place, so the numbers from all 10 platforms sit in one per-client view. Viraly Post holds each client in its own workspace and pulls every connected platform into one analytics view, so the dashboard is a single screen you can hand to the client instead of a report you rebuild from ten sources every month.
How to set up a client reporting dashboard in 6 steps
Treat the dashboard as a one-time setup per client, then a thing you barely touch. The work is front-loaded, and after that the client serves themselves.
- Create one workspace per client so each account's data stays isolated and nothing bleeds across dashboards.
- Connect every platform the client runs across the 10 native integrations so all the numbers land in one view.
- Pick the three or four metrics that map to that client's goal, whether that is leads, sales, reach, or community growth, and make them the top of the view.
- Add your agency logo and colors to the client-facing surfaces so the dashboard reads as your work, not the tool's.
- Generate a view-only share link for the workspace and send it once, so the client can open the dashboard anytime without an account.
- Keep the monthly report, but shrink it to a short written read on what the dashboard already shows and what you will do next.
Six steps, and only the last one repeats. Workspaces, connections, metrics, branding, and the share link are done once per client. After that the dashboard runs itself and the client stops emailing you for numbers.
Give clients view-only access without another login
The reason client dashboards usually fail is the login. Ask a client to create an account and remember a password to see their own numbers, and they will not. They will email you instead, which puts you right back to pulling numbers by hand. A dashboard only saves time if the client can actually get into it.
So the access has to be password-less. With Viraly Post you share a view-only link to the client's workspace, the same calendar and dashboard sharing that powers client-facing views elsewhere in the product. The client taps the link, sees the dashboard and the calendar, and cannot change anything. No account, no password, no support ticket when they forget it. It is the same password-less idea behind the approval workflow, pointed at reporting. For the full view-only setup, see our guide on which social media metrics to report to clients.
What to put on the dashboard, and what to leave off
A client dashboard earns its place by being read, which means it has to be short and pointed. Put the result the client cares about at the top: the leads, the sales, the saved ad spend, or the reach that maps to their goal. Under it, show the two or three supporting metrics that explain the result. That is the whole top of the view, and for a lot of clients it is the whole view.
Leave off the vanity counts that do not tie to a goal, and leave off anything that needs a paragraph to interpret, because a dashboard has no room for paragraphs. The writing goes in the monthly report, which sits on top of the same branded setup covered in our white label client reporting guide. The dashboard shows, the report explains, and both pull from one source so they never disagree.